Datathon 2015 Recap
It took me two weeks after the event to find time to say a few words about Datathon 2015, which took place on October 3-4. So here we are…

Just like with Battlehack, the whole “adventure” started with Stavros (Tsourlidakis), who sent me the event link one evening and asked if I was interested in participating.
The interesting part was that just a few days before, I had completed an R course on EDx, which I had started over the summer. Although it was a beginner’s course, it was enough to spark my interest in the world of big data and data analysis.
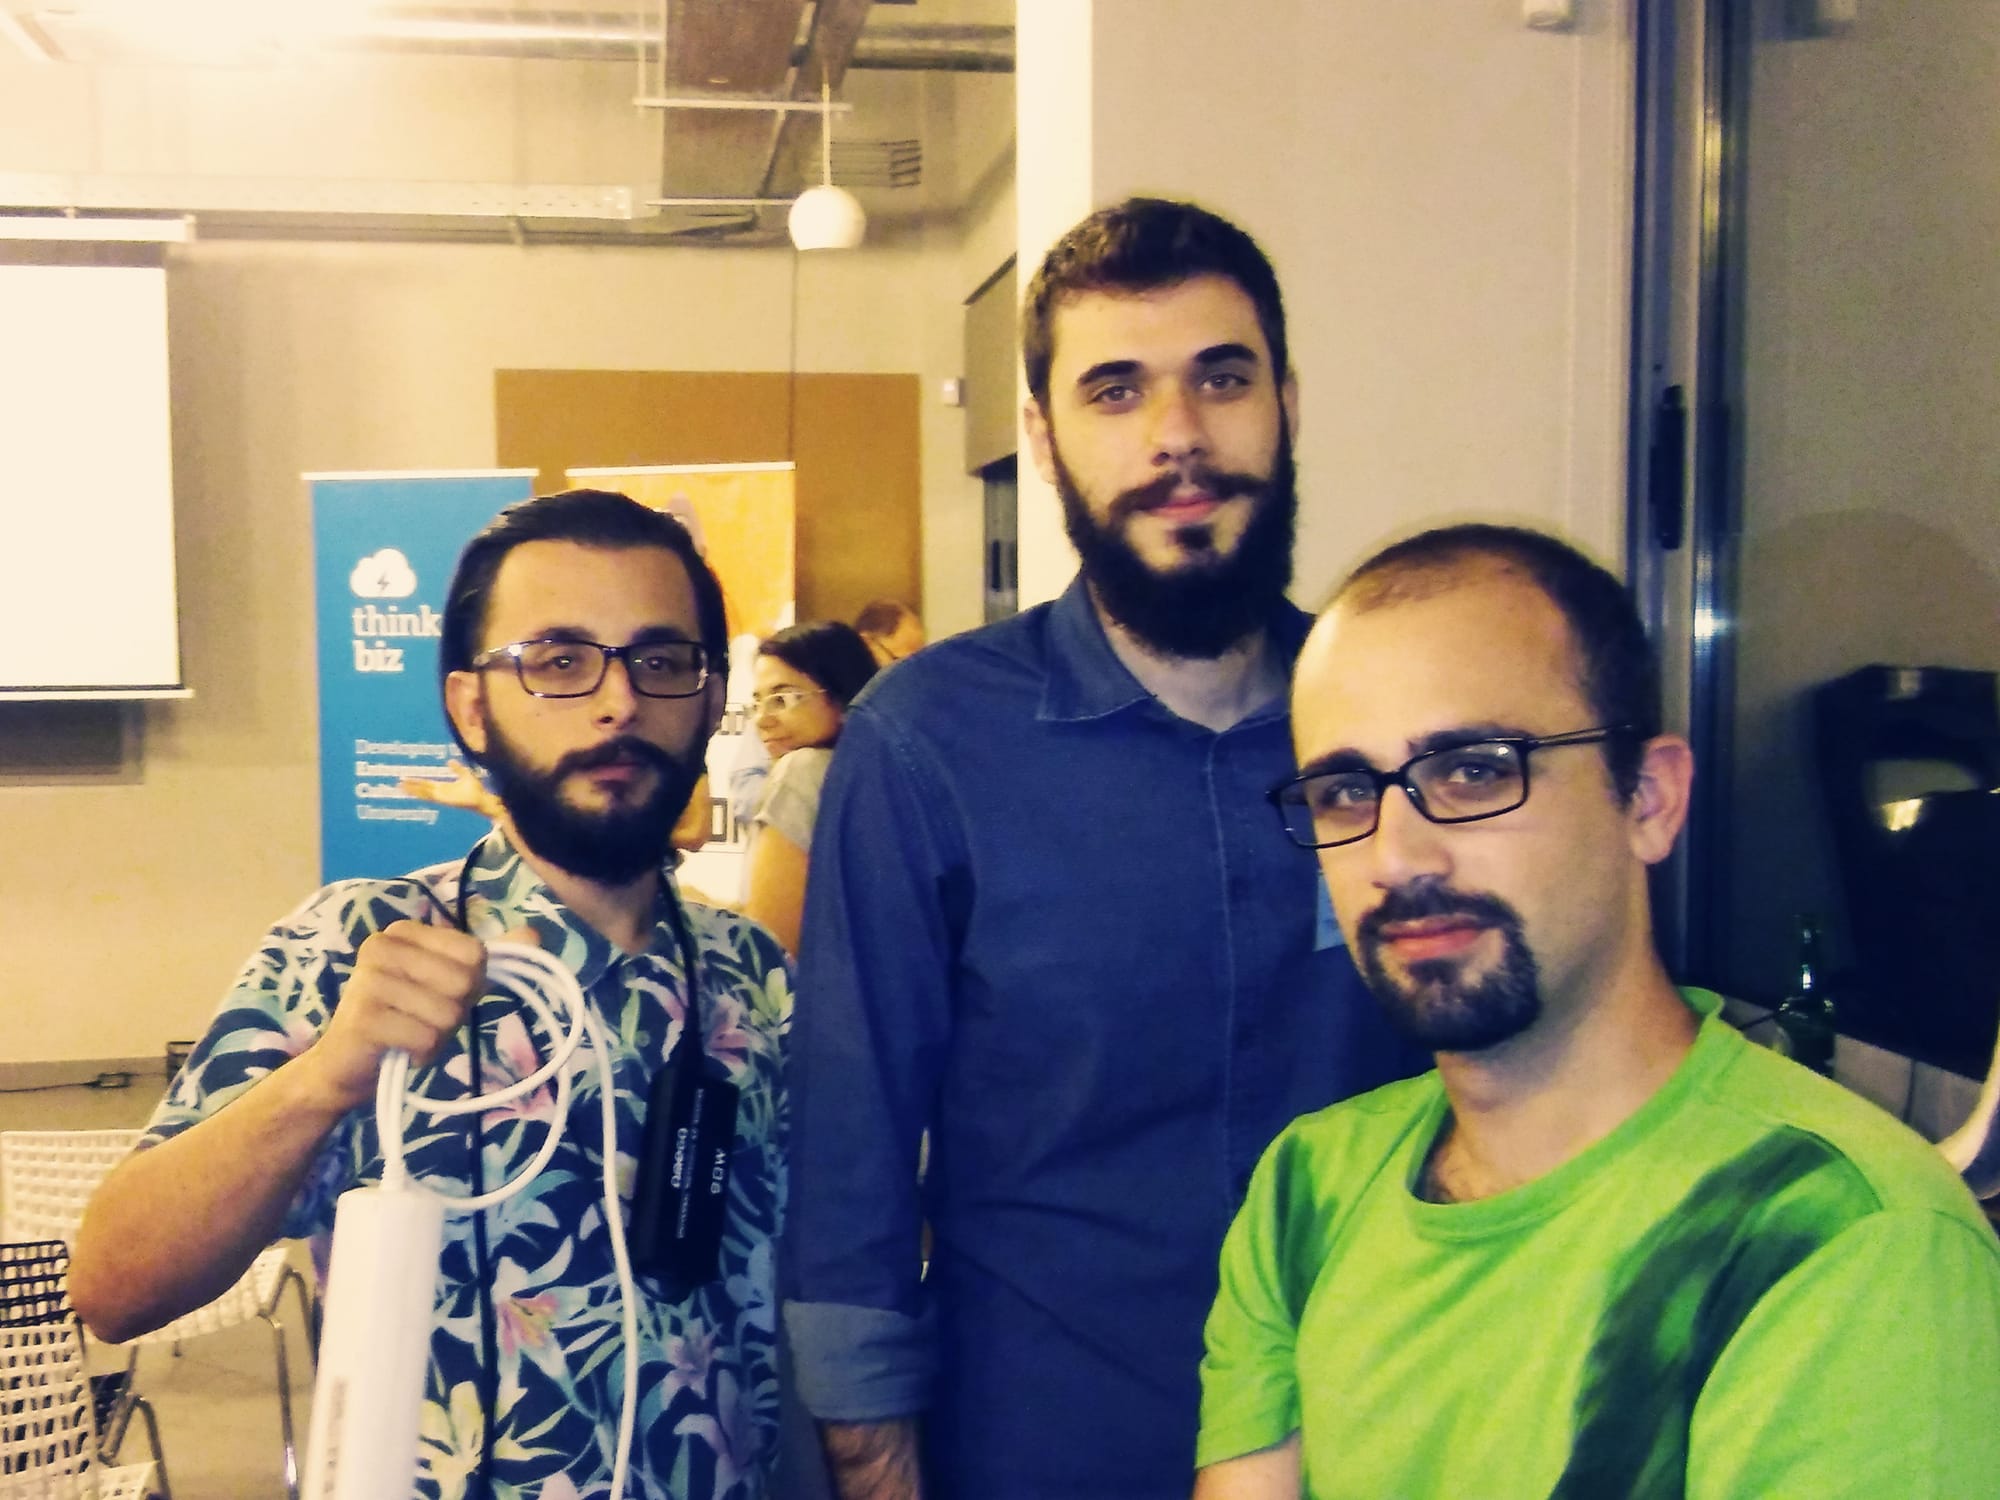
So when I saw the theme of the Datathon that Stavros sent me, I said yes without a second thought, and we signed up together with Dimitris (Barbakos). Dimitris and I hadn’t met in person before, but we had been collaborating remotely on Hermes-V (more on that soon). It was an opportunity to meet in person.
What Was It?
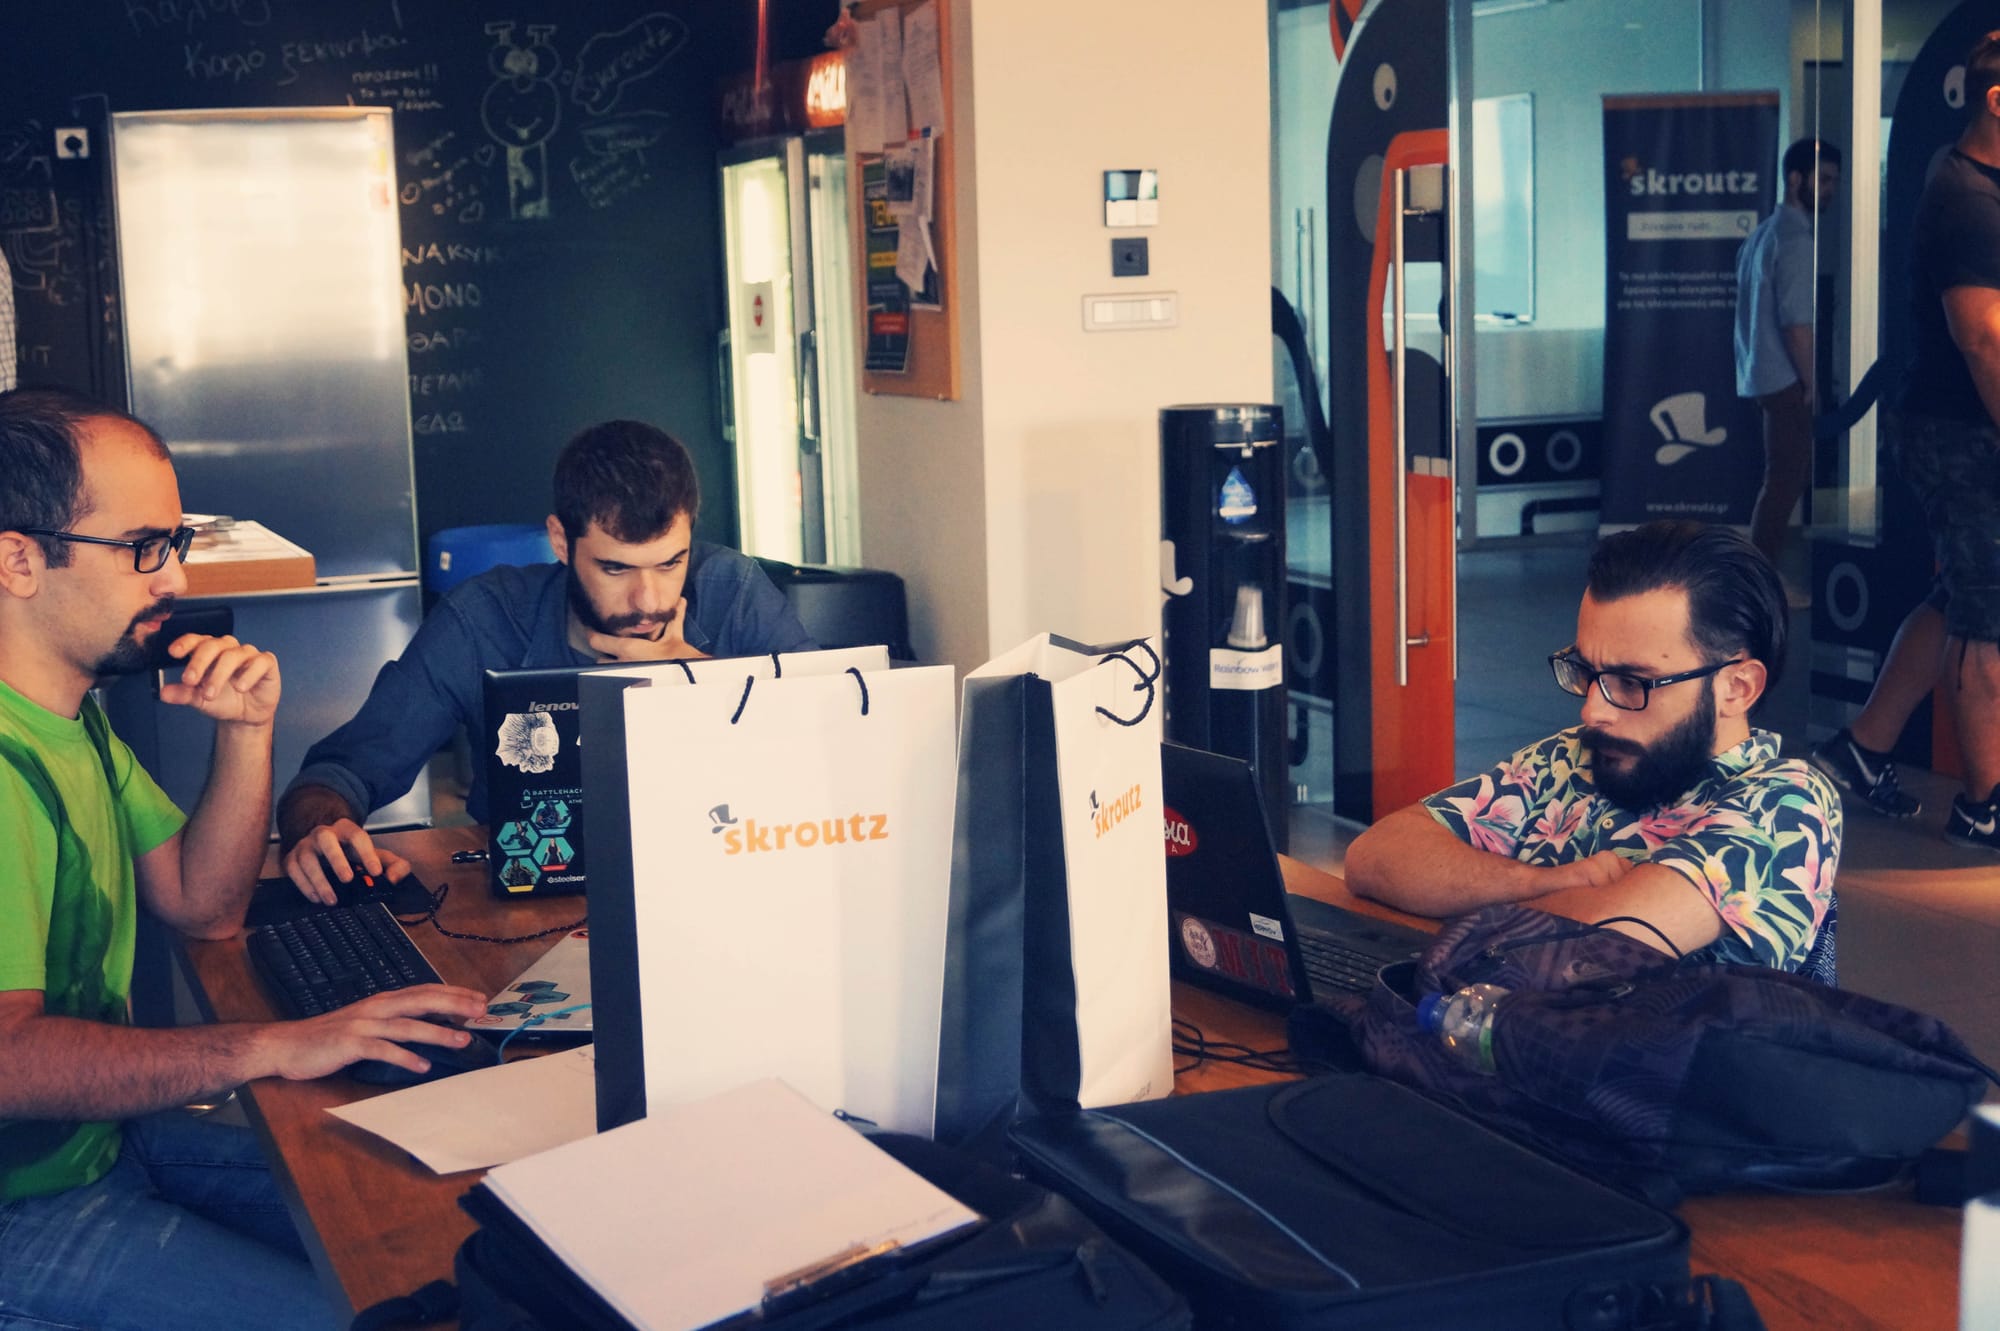
Datathon (which I assume is a combination of “data” and “hackathon”) was a hackathon focused on data analysis. It was organized for the second time by Thinkbiz at the Skroutz offices (or Skroutz Awesome Factory, as they like to call it) in Nea Ionia.
The goal was to analyze a dataset (4GB) provided to us and draw conclusions and improvement suggestions.
The Event from Our Perspective
None of us had any knowledge on the subject. None of us had previously dealt with analyzing such a large dataset. So, initially, we tried different approaches to the problem.

Dimitris, being an electronics expert, instinctively tried to load the dataset into Matlab. Stavros, as a web developer, tried to load the data into MySQL using PHP, and I, having had a taste of EDx, attempted to load the dataset into R-Studio.
The issue with me was that on EDx we used a web environment specially designed for the course. I knew some basic commands, but setting up my R environment was a new experience. I was starting from scratch.
Stavros, on the other hand, had difficulty loading the data into the database due to its volume. Although it was feasible, with some rough calculations we made, it seemed we wouldn’t be able to load (let alone process) the data within the remaining 6 hours.

We all agreed to focus on R. The others also downloaded R Studio and we started the data loading. Practically, in the next 4 hours, we all learned R since what I had done on EDx, although useful, covered only 10-15% of what we needed to do.
With that, we had only 1 hour left. Stavros began designing the presentation, which we agreed to make as a web page rather than PowerPoint, and the rest of us helped wherever we could.
In the end, we had three charts based on our conclusions. Due to time constraints, the presentation was incomplete and our weak point was covered up by Dimitris with a very nice speech, earning us an (unofficial) 3rd place.
You can find more about the winners and the event on the Thinkbiz and Skroutz blogs.
